Commerzbank Rohstoffradar Oktober 2023
Wird Gas im Winter knapp?
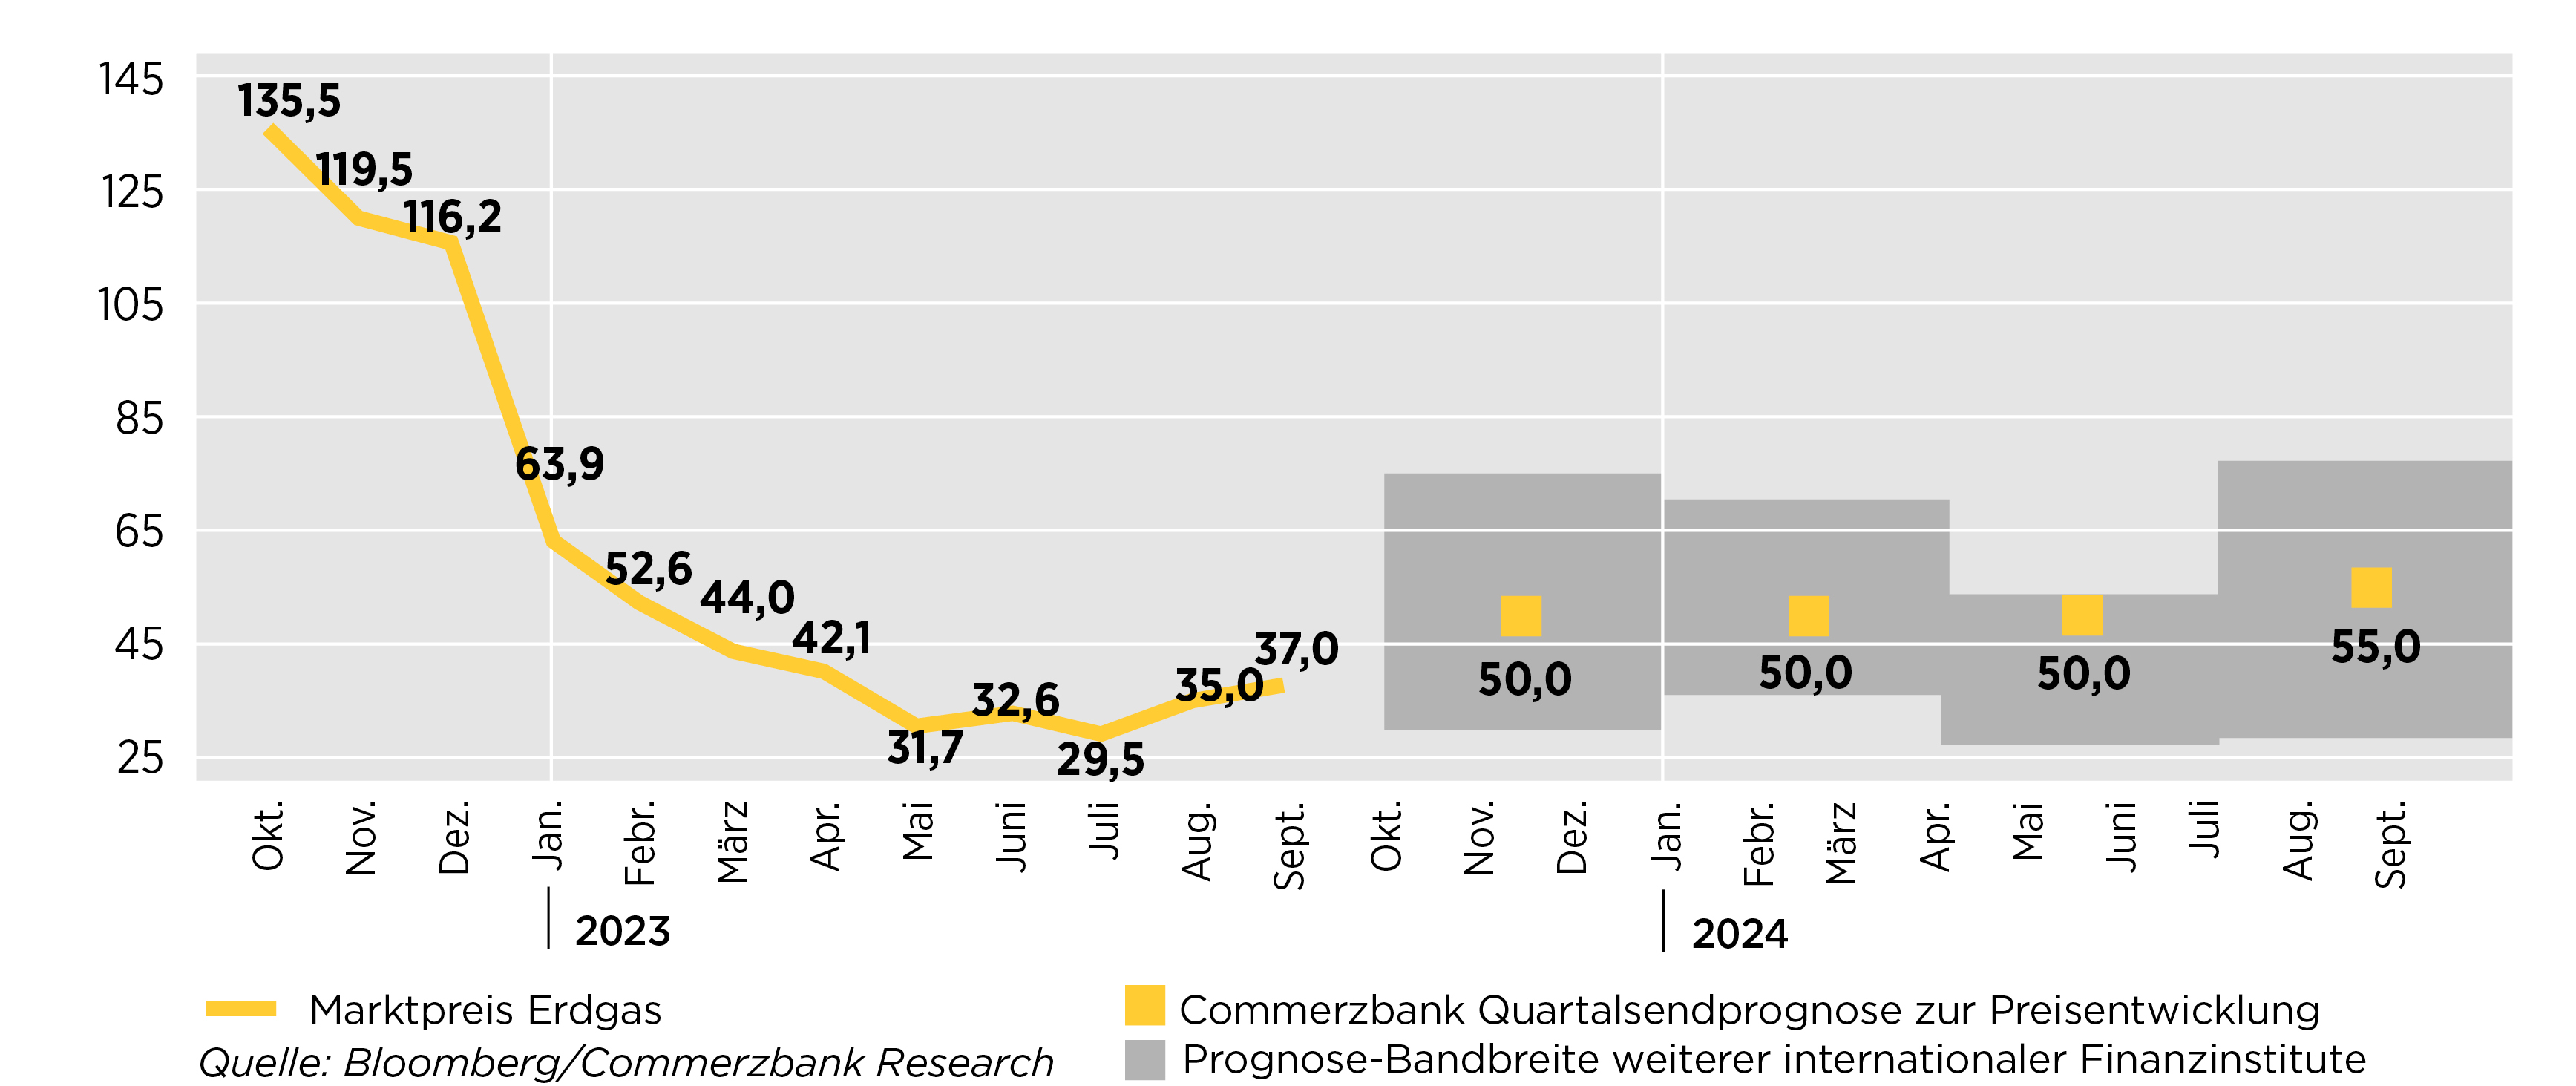
Europa geht mit nahezu vollen Gasspeichern in die Heizsaison: Sie sind aktuell schon zu 95 Prozent gefüllt und damit besser als es zum 1. November in der EU verpflichtend ist. Dennoch hat die Nervosität am Gasmarkt zugenommen, die Preisausschläge werden größer. Mit rund 48 Euro je MWh notierte der Benchmark-Preis TTF Ende September zwischenzeitlich fast doppelt so hoch wie im Zwei-Jahres-Tief im Juni. Schließlich steht die EU mit dem zum Winter nun wieder steigenden Bedarf abermals vor der Frage, ob das Gas knapp werden könnte.
Um es vorwegzunehmen: Wir gehen davon aus, dass eine sogenannte Mangellage erneut ausbleibt. Dafür spricht vor allem, dass die Gasnachfrage schwach bleibt. In der letzten Heizperiode übertraf der Rückgang der Gasnachfrage sogar den Ausfall der russischen Importe. Da ein Fünftel der Einsparungen laut Internationaler Energieagentur der milden Witterung zu verdanken war, wir aber eine Wiederholung überdurchschnittlicher Temperaturen nicht voraussetzen können, ist mit einer gewissen Nachfrageerholung zu rechnen. Gleichzeitig sprechen aber einige Faktoren für eine weiterhin gedämpfte Nachfrage: Zum einen geht ein Teil der Einsparungen auch auf veränderte Verbrauchsgewohnheiten zurück. Die Gaspreise sind zwar von ihren Rekordhochs deutlich zurückgekommen, bleiben jedoch im historischen Vergleich hoch und motivieren zu Sparsamkeit. Zum anderen trüben sich die Konjunkturperspektiven ein, weil die Straffung der Geldpolitik immer mehr Wirkung zeigt. Auch aus dem Ausland sind kaum positive Impulse zu erwarten, sodass die Produktionserholung in den energieintensiven Sektoren auf sich warten lassen wird.
Damit dürfte die Gasnachfrage in den kommenden Monaten zwar etwas höher ausfallen als im letzten Winter, die Erholung sollte jedoch moderat bleiben. Sofern die Gaszuflüsse das Niveau der ersten Jahreshälfte halten, sollten die Speicherstände ausreichen, um den erhöhten Bedarf in den Wintermonaten zu decken.
Erdgaspreis in EUR je MWh

Allerdings sind die Risiken deutlich höher als früher. Auf der Angebotsseite gelang es der EU zwar, fast die Hälfte der (fehlenden) russischen Pipeline-Bezüge über LNG-Lieferungen auszugleichen (jeweils im Vergleich zu 2021), doch am derzeit ohnehin eher knappen globalen LNG-Markt kann sich die Lage schnell anspannen. Schon allein aufgrund der schieren Größe der Anlagen bergen einzelne Ausfälle die Gefahr einer Markteinengung. Weitere Risiken sind:
- Ein deutlich kälterer Winter
- Eine stärkere Nachfrage, weil die Straffung der Geldpolitik erst verzögert wirkt
- Eine höhere Preiselastizität, die zu einem stärkeren Anstieg der Nachfrage aufgrund der im Vorjahresvergleich deutlich niedrigeren Preise führt. Dies gilt sowohl für die privaten Verbraucher als auch für die Industrie
- Ein Wegfall der verbleibenden russischen Gasbezüge bei einem gleichzeitig intensiveren Wettbewerb um LNG-Importe aufgrund einer im Vergleich zum Vorjahr stärkeren Nachfrage außerhalb Europas
Wir warnen deshalb trotz der guten Startbedingungen davor, die Risiken am europäischen Gasmarkt zu unterschätzen. Vielmehr erwarten wir, dass der Markt für kurzfristige Lieferungen im Winter bereit ist, Risikoprämien zu zahlen, sodass die Preise in den Wintermonaten noch etwas steigen sollten. Zum Jahresende rechnen wir mit einem Preis von 50 Euro je MWh. Auch mit Sicht auf das nächste Jahr erachten wir die Preise als gut unterstützt, weil dann ein höherer Bedarf von der Konjunkturseite kommt: Im Jahresverlauf sollten die EU und die USA die durch die hohen Zinsen ausgelöste Rezession überwinden. Gleichzeitig bleibt das LNG-Angebot eingeschränkt. Das Institute for Energy Economics and Financial Analysis (IEEFA) schätzt das Wachstum des globalen LNG-Angebots in diesem und im nächsten Jahr auf nur 3 Prozent. Erst ab 2025 rechnen die Experten mit einer Welle an neuen Projekten, die dann zu einer dauerhaften Entlastung bei den Preisen führen sollte.
Quelle: Commerzbank Research 05.10.2023
Jahreshöchst- und tiefstpreise im Überblick
| in EUR je Einheit | in EUR je Einheit | ||||
| Edelmetalle | Agrarrohstoffe | ||||
| Gold je Feinunze |
Höchst Tiefst |
1.874,04 1.484,34 |
Baumwolle je Pfund |
Höchst Tiefst |
1,47 0,84 |
| Palladium je Feinunze |
Höchst Tiefst |
2.898,54 1.422,35 |
Kaffee je Pfund |
Höchst Tiefst |
2,40 1,65 |
| Platin je Feinunze |
Höchst Tiefst |
1.057,57 817,47 |
Kakao je Tonne |
Höchst Tiefst |
2.221,74 1.873,92 |
| Silber je Feinunze |
Höchst Tiefst |
24,13 17,90 |
Mais je Tonne |
Höchst Tiefst |
379,00 219,50 |
| Weizen je Tonne |
Höchst Tiefst |
438,25 253,25 |
|||
| Zucker je Pfund |
Höchst Tiefst |
0,19 0,15 |
|||
| Industriemetalle | Energie | ||||
| Aluminium je Tonne |
Höchst Tiefst |
3.548,87 2.183,52 |
Diesel je Tonne |
Höchst Tiefst |
1.312,38 523,29 |
| Blei je Tonne |
Höchst Tiefst |
2.267,96 1.807,32 |
EUA je Tonne |
Höchst Tiefst |
98,01 54,92 |
| Eisenerz je Tonne |
Höchst Tiefst |
152,53 75,85 |
Erdöl Brent je Barrel |
Höchst Tiefst |
117,15 60,82 |
| Kupfer je Tonne |
Höchst Tiefst |
9.794,98 7.083,78 |
Gasöl je Tonne |
Höchst Tiefst |
1.283,23 530,24 |
| Nickel je Tonne |
Höchst Tiefst |
44.322,76 15.426,89 |
Kerosin je Tonne |
Höchst Tiefst |
1.407,72 548,23 |
| Zink je Tonne |
Höchst Tiefst |
4.226,61 2.561,31 |
Kohle je Tonne |
Höchst Tiefst |
420,18 98,22 |
| Zinn je Tonne |
Höchst Tiefst |
44.654,12 20.872,57 |
Strom je MWh |
Höchst Tiefst |
674,75 140,92 |
Quelle: Bloomberg, Periode: 27.09.2021 - 28.09.2022
Aus Sicht deutscher Unternehmen notieren die aufgeführten Rohstoffe in der Regel in Fremdwährung. Neben Rohstoffpreisrisiken sind somit zusätzlich Währungsrisiken zu berücksichtigen.
